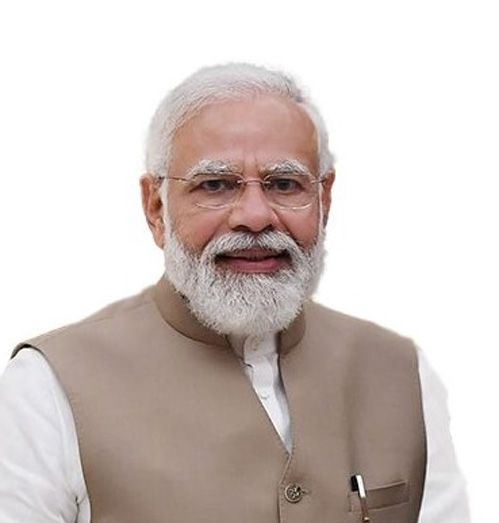
Shri Narendra Modi
Hon'ble Prime Minister
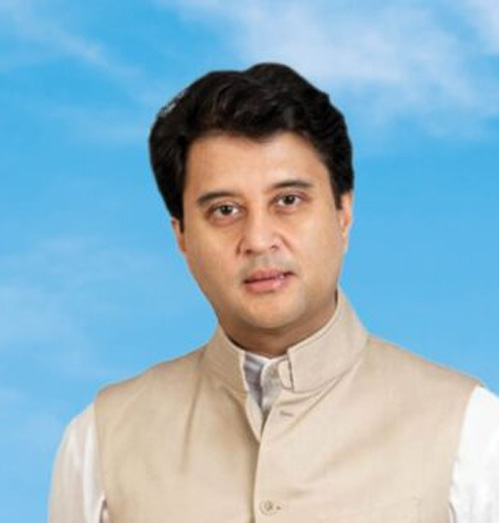
Shri Jyotiraditya M. Scindia
Union Minister for Communications
and Development of North Eastern Region
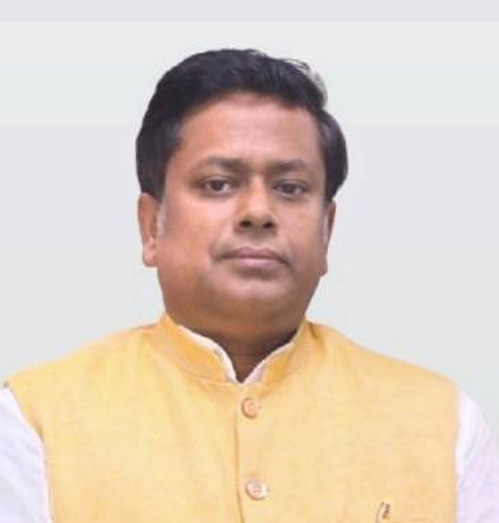
Dr. Sukanta Majumdar
Union Minister of State for Education
& Development of North Eastern Region
8
NE States Covered
132
Districts Profiled
25
Sectors
2000
Web portal Launched
Welcome to the NER Databank
Brought to you by NEDFi
Explore the most comprehensive and organized repository of information on the North Eastern Region of India — covering Assam, Arunachal Pradesh, Manipur, Meghalaya, Mizoram, Nagaland, Sikkim, and Tripura.
The NER Databank brings together essential economic, geographic, demographic, and sectoral data under one digital roof — designed to support policymakers, businesses, researchers, and development professionals working to shape the region's future.
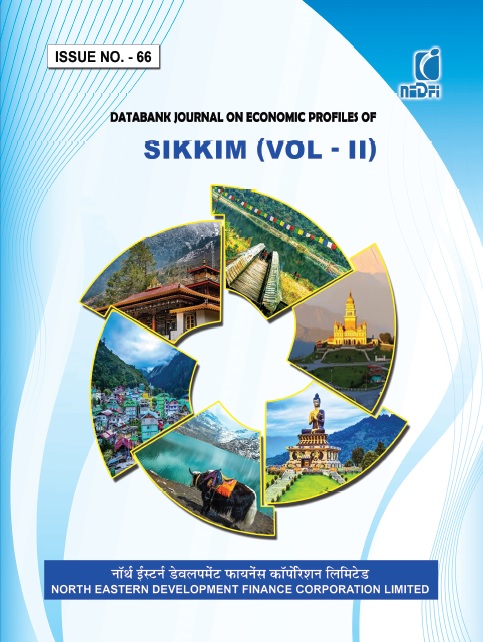
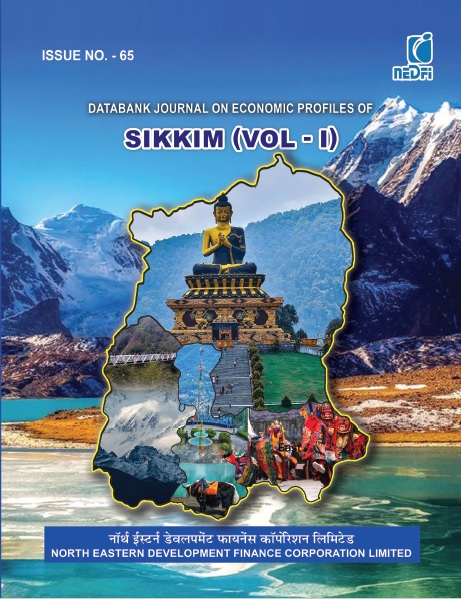
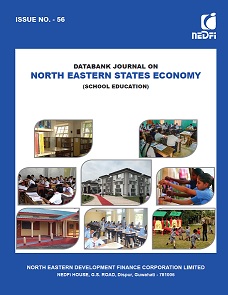
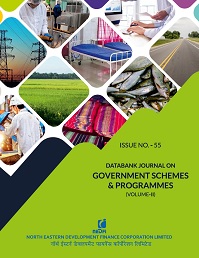
NEDFi Databank Journal
The NEDFi Databank Journal offers comprehensive economic data on specific sectors or topics related to the North Eastern Region. This initiative aims to attract investments and foster business opportunities in the region while serving as a valuable resource for students, policymakers, researchers, and aspiring entrepreneurs.


